All modern desktop browsers now have integrated browser tools, however, there are subtle (and sometimes less subtle) differences between each. I find that Firefox has the best overall, though I do switch to Chrome for some specific debugging tasks. I personally only use Edge or Safari when trying to isolate a bug that only shows up on those browsers, so I will not be speaking directly about those browsers’ features, simply because I am less familiar with them.
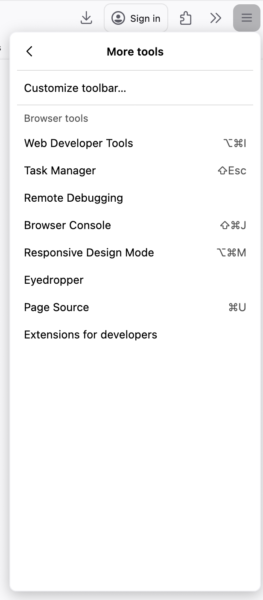
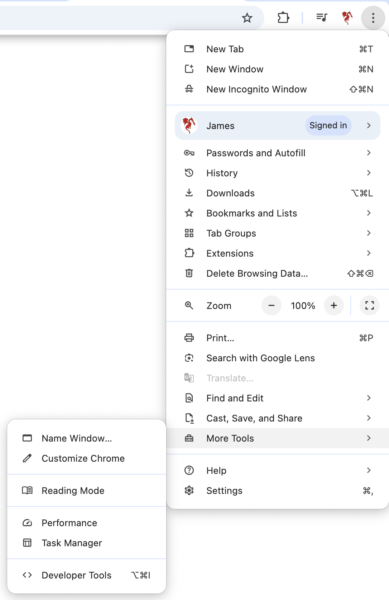
Developer Tools can be found in the hamburger menu under More Tools, however I find it quicker open them using right click > Inspect (or Inspect Element, depending on the browser). Usually I want to debug a specific element anyway; if you’re just opening the console or looking for page load time information, you can right-click anywhere on the page; it doesn’t really matter which element you pull up first.
Firefox
Chrome
The first time you open the Developer Toolbar, you’ll want to go to the toolbar settings and change which tools appear in the top bar of the toolbar, just to clean things up and make sure you can easily access everything you are likely to need. In Chrome, you can find Settings in the ⠇menu at the top-right of the toolbar, in Firefox you’ll find the cog symbol right beside the menu icon. In both cases, if there is a cog below that, that is the settings for the specific tool you’re currently using.
Firefox
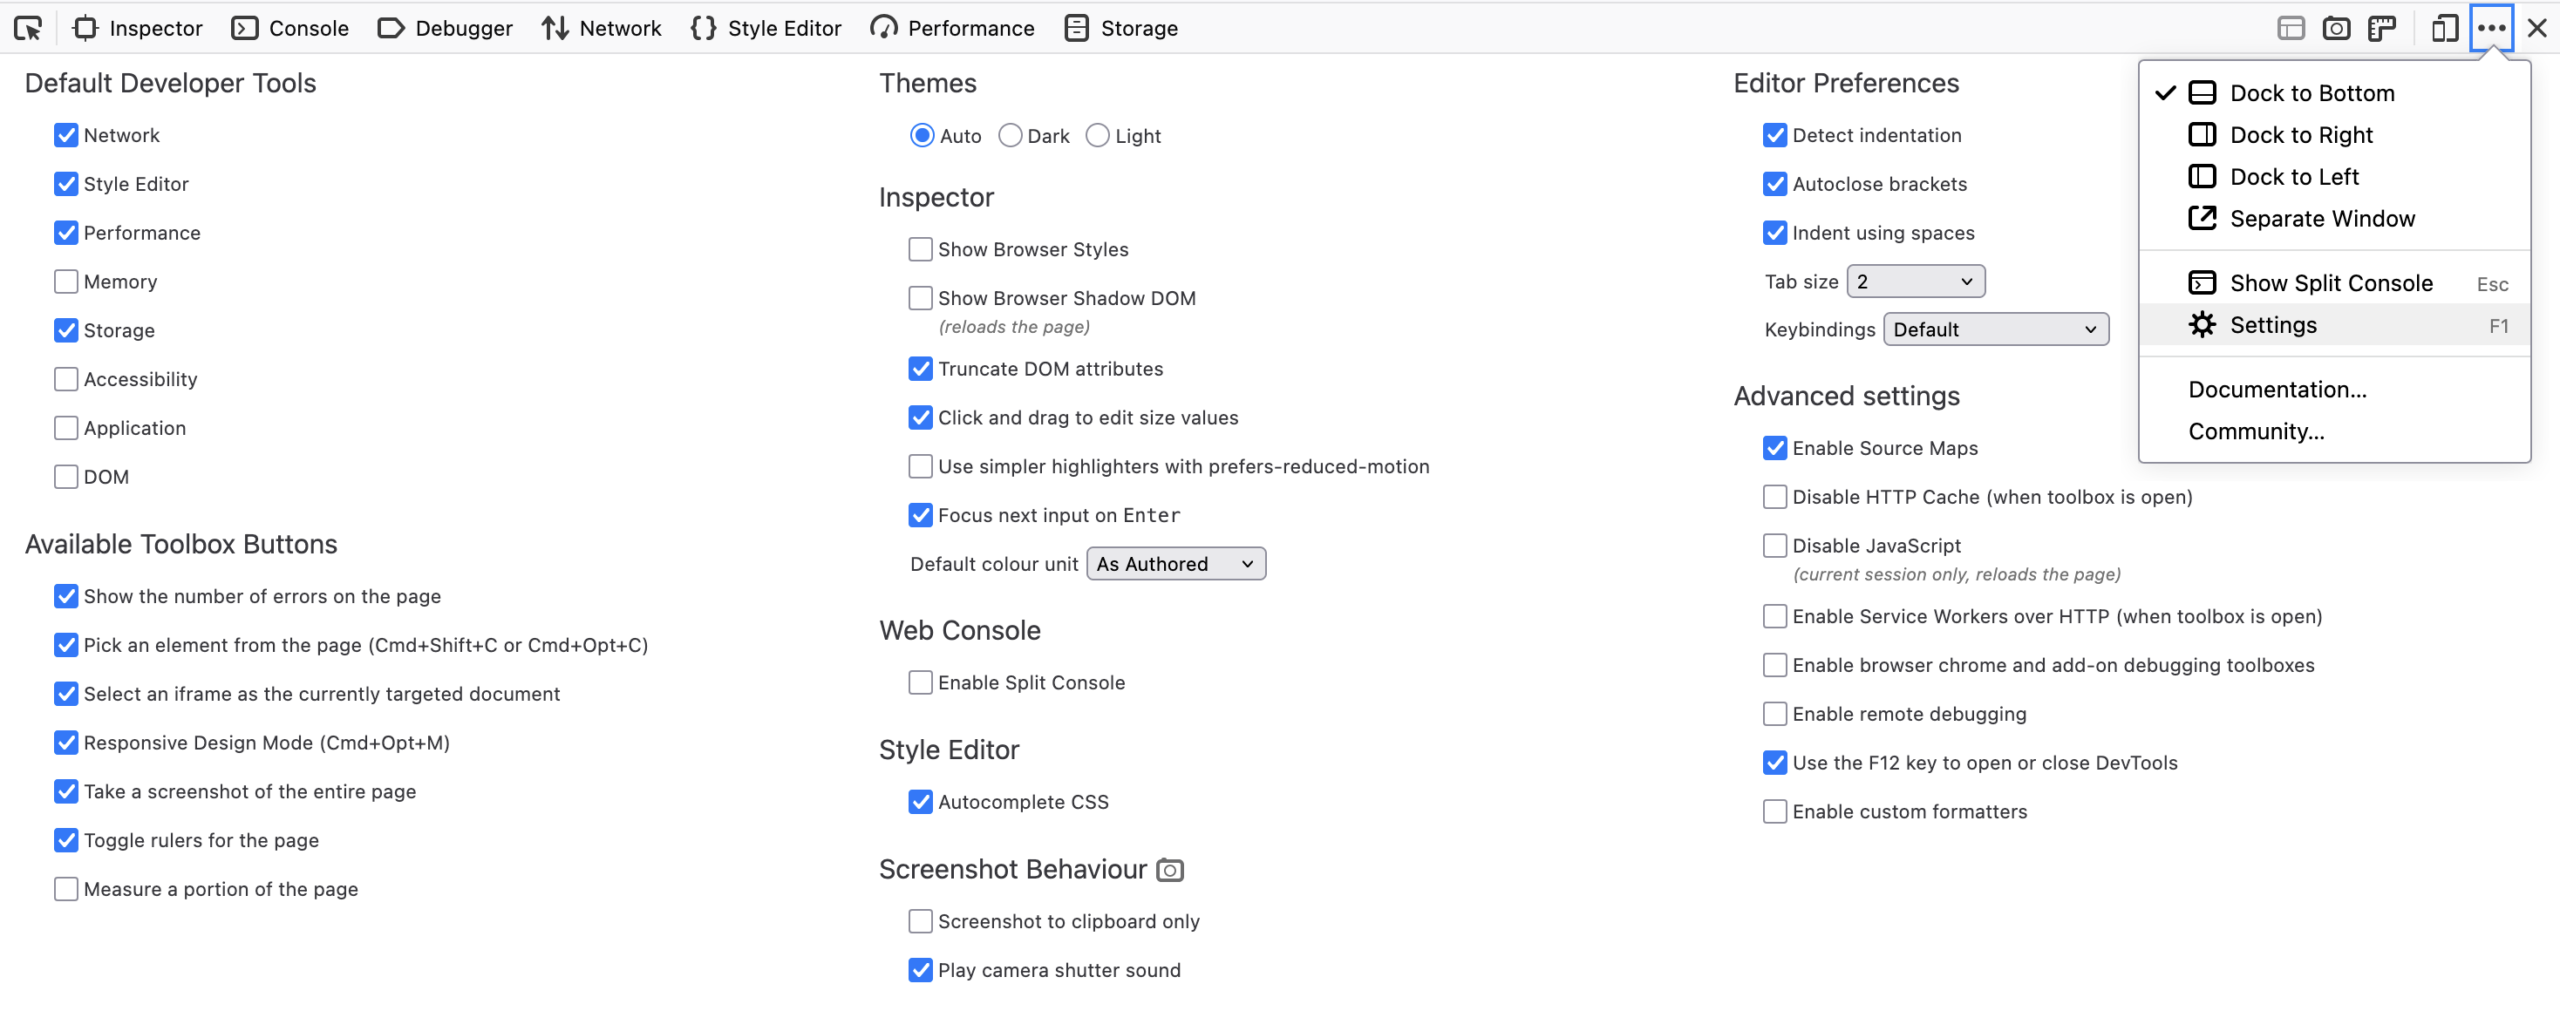
For those starting out, I recommend keeping Inspector (Elements in Chrome), Console, Debugger, Style Editor (Debugger and Style Editor are combined into Sources in Chrome), and Network turned on.
The Storage tab will allow you to inspect cookies or local storage/session storage contents, or clear those from the cache for your current page only, so if you are debugging scripts that use either of those, then you will likely need that one. (Chrome’s Application tab includes combines the features of Firefox’s Storage and Application tabs.) The Performance tab will give you some additional performance information than is available on the Network tab (e.g. time to first paint rather than to complete page load) but this tab is quite different between browsers, so may or may not be at all useful to you.
Most of the other options in the main Dev Tools settings depend on your own preferences (dark/light theme, indent size, screenshot to clipboard or to a file, etc) and don’t make much functional difference, but you can see my own settings in the screenshot above to perhaps give you a starting point. If you see something in a tutorial which looks different on your own computer, or that is using a feature you don’t seem to have on your screen, check the settings to see if you’ve turned something off that you do need after all. If that doesn’t seem to be the case, it may be something that isn’t available on the browser you are currently using, or, it may simply be named something different – don’t be afraid to play around.
Nothing you do in Developer Tools will be saved to your site or visible to other users!
I will add links to each section below when more detailed tutorials for each tool are available.
Inspect Page Element
The element inspector is the first tool you should become very familiar with. You can either right-click on an element and pick Inspect to make it the focused element, toggle the element selector (arrow-to-box icon in the very top left of the toolbar) to click around on the page, or navigate through the html directly in the toolbar. You will then be able to see the specific CSS rules that apply to that element, it’s exact dimensions, etc.
Under the Layout sub-tab, you can also turn on overlays for individual Flexboxes and Grids on your page, which allows you to better visualize what the heck the code is actually doing with those elements.
When inspecting the CSS styles applied to an element, you can edit the values in the toolbar to preview what those changes would do to your page, or use the + button to add completely new css rules. I find Firefox to be the least buggy browser when it comes to this feature. Chrome is okay with new rules, iffy with editing existing rules in place, and will completely remove pseudo-elements (:before, :after, :marker, etc) when you set them to content: none or display: none, meaning you won’t be able to get them back without reloading the page, which will undo any other changes you’re currently previewing.
By clicking on the line number to the right of each style rule, it will open it in the Style Editor (or Sources) tab, so you can see that rule in the context of the code around it, which can help you find it in your Stylesheet to edit it for real, or (if your stylesheet is organized logically) take a look through the code immediately above or below it to find a related rule that is maybe not being applied.
Developer Console
The console’s first use is to display any error messages related to the current page (you can set it to retain messages from previous pages as well). This includes all JavaScript errors, and errors related to loading page elements (e.g. if an image can’t be found), but it will not tell you if you have an error in your html or css itself – you will need to use an external validator for that. I recommend validator.w3.org
The second use of the Console is to execute JavaScript directly. You can simply type the name of a variable and hit enter to view the current value of that variable (assuming it is not scope-limited to a single function), or you can execute entire lines of javascript. For example, if you suspect a specific bit of math in a javascript function is mathing wrong, you could execute just that line in the console rather than having to step through the entire function in the Debugger, or you could test the result of calling function with different parameters than you currently have on your page, or quickly test a new script, or changes to a script, without first actually saving those changes to your page, similar to previewing style changes in the element inspector.
Debugging
In the Debugger tab (Sources tab in Chrome) you see all the external resource files that are used by the page, as well as the webpage itself, and search for a specific phrase in any file. For example, if something added to the page with JavaScript seems to be duplicated, you can easily find out if the relevant script code was actually included twice in different places, or you can check for sure if a resource such as a font or other external file was linked correctly, since the Console error log can tell you if it failed to fetch a url with a typo in it, but not if the link to that resource is not coded correctly (or at all) in the html of the page.
As well, you can set a breakpoint on a specific line of code inside a script tag or in an external file, which will pause the javascript just before it executes that specific line. This allows you to confirm that a specific line of the code (for example inside an if statement) actually runs or not; check the value of any variable at that precise point; test the insertion of an additional line of code at that point by running it at that console; or step through the code line by line to see how the page changes at every point during a script.
In Firefox, you will need to load or refresh the page while the Debugger tab is open, as it won’t automatically load that page’s code into the debugger otherwise.
Performance Checking
If you have concerns about your page load speed, you can go to the Network tab and reload the page. It will then provide a list of all files used by the page as they are loaded, although you can also filter it by filetype, for example to see only images, or only external script files, etc. For each file, it will tell you some information about the file (url, file size, etc) and how long it took both to fetch and to load the file. It will also display a waterfall chart, which is a timeline representation of when each file started and finished loading. While this provides less information than a full-blown performance tool (I use GTMetrix, which is free but does require an account) it is a quick way to see if there is a specific file or image which is taking an absurdly long time to load.
Images which are either extremely large and not optimized, or which can’t load at all, are nearly always the biggest culprits in sluggish page loads – this becomes extremely apparent and hard to avoid in somewhere like a memberlist, where multiple users may not know how to correctly crop or optimize images, or may not fix their profile promptly if an image host goes down or is blocked. However, ensuring that all the images used by your skin are correctly sized and optimized will help a lot, especially with the home page. Common culprits are splash background images and default avatars – by saving the former as jpg rather than png, and cropping or resizing avatars, icons, etc to be only as large as needed, you will often save quite a bit of load time.
The waterfall chart will also provide a clue when certain files are “blocking” the browser from fetching other files or loading further parts of the page, commonly these are script files in the head. If possible, moving scripts to the bottom or loading them with the async attribute (which tells the browser not to wait for them to completely load before requesting other files) will speed up the visible page load time, even if it technically takes roughly the same amount of time to completely load everything behind the scenes, which will certainly improve the way it feels to use your site. However, some files (e.g. JQuery framework) do need to be loaded before anything else which might try to use them, in which case you might be stuck. Luckily, many of these files will be cached by the browser, so subsequent page loads by the same user will be faster.
Turn off browser cache in the Developer Tools settings, or hold shift while refreshing the page, to see how much longer a page will take to load for someone who has never been to your site before, or who is using Icognito/private browsing mode or a public computer.
In Chrome, the Performance tab will give you the absolute basic stats about the page’s load time, and whether it meets typical standards for if it’s good or needs improvement. In Firefox, the Performance tab will give you a lot more information; you will need to click Start Recording, reload the page and wait for it to completely finish loading, then click Capture Recording. For the most part, though, I find that the load time information in the Network tab is sufficient to identify any obvious problems, and for a non-commercial website, that is usually good enough.